Monitoring energy is a rather large interest of mine - my family have solar panels. It's interesting to see trends in our energy usage with my app, however it doesn't give us any information about which devices in particular are using the most energy.
I happen to use a HS110 smart plug to control my desk but was disappointed by the little information that the Kasa application displays and therefore have never used it to track my energy consumption. Today I got a bit of free time and decided to look into reverse engineering the smart plug. Luckily this had been done before by @ggeorgovassilis on GitHub so I didn't need to look into it myself - I just grabbed the script, made a few modifications and then wrote my own logging shell script.
This was one of my first properly functional shell scripts and, wow, I actually quite like working with shell scripts. They are versatile and reliable and also fun to write. I had to look up a few different things while developing the script and learned quite a bit in the process. You're probably thinking at this point that I've written something complex but I really haven't - I'm just a bit of a shell noob.
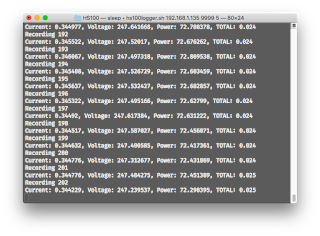
The script uses python to parse the JSON response (thanks to this useful SO post) from the plug into different variables and then simply appends them to a csv file. It does this in an infinite loop with a configurable delay.
 There's details on how to use the script in the repository's README.md and of course it's all there for you to pick apart and tell me how my syntax is all wrong... If you have any trouble getting it to work properly, or just even end up using it let me know in the comments or on Twitter!
Once you've logged the energy consumption for a certain time period, you can import the file into excel and use the tools to plot power over time. Below is some data that I gathered from different appliances.


I happen to use a HS110 smart plug to control my desk but was disappointed by the little information that the Kasa application displays and therefore have never used it to track my energy consumption. Today I got a bit of free time and decided to look into reverse engineering the smart plug. Luckily this had been done before by @ggeorgovassilis on GitHub so I didn't need to look into it myself - I just grabbed the script, made a few modifications and then wrote my own logging shell script.
This was one of my first properly functional shell scripts and, wow, I actually quite like working with shell scripts. They are versatile and reliable and also fun to write. I had to look up a few different things while developing the script and learned quite a bit in the process. You're probably thinking at this point that I've written something complex but I really haven't - I'm just a bit of a shell noob.
The script uses python to parse the JSON response (thanks to this useful SO post) from the plug into different variables and then simply appends them to a csv file. It does this in an infinite loop with a configurable delay.

Once you've logged the energy consumption for a certain time period, you can import the file into excel and use the tools to plot power over time. Below is some data that I gathered from different appliances.
Example Graphs
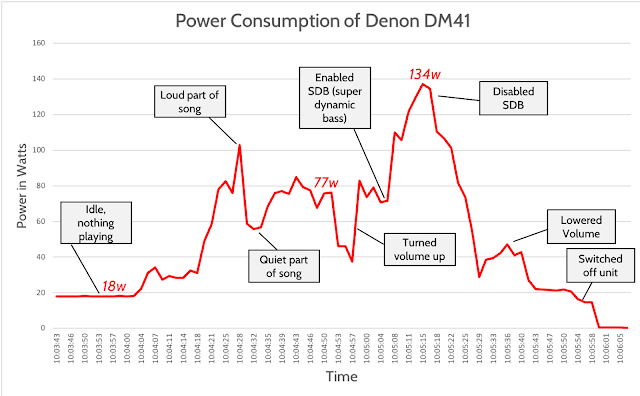
Speakers (data)
I played the new track Big Man by Childcare on my speakers while recording power every second. At one point I enabled SDB (super dynamic bass on my Denon DM41) and noticed a large increase in power consumption. These key points are labelled on the graph.

Garage Freezer (data)
This is 14 hours and 45 minutes worth of data from our garage freezer, in which it used 0.562kWh. This has helped us identify how often the freezer is using power - it runs for an hour and a half and then rests for just over an hour.

Vacuum Cleaner (data)
Here's the graph of a 10 minute session with the plotting resolution set to 1 second. Note the peak in consumption when the vacuum is switched on.

Are you using the HS100 or HS110? As the HS110 gives you energy monitoring information, but the HS100 doesn't. Wondering if it technically does from the code, or if its a typo?
ReplyDeleteYep you're right, I have the HS110. Thanks for pointing this out!
DeleteHey Dan Is it possible to do this in an app or on my phone?
ReplyDeleteHey Dan Is it possible to do this in an app or on my phone?
ReplyDeleteHey Dan Is it possible to do this in an app or on my phone?
ReplyDelete